The purpose of the project was to create a web application that demonstrated the use of chart widgets and localStorage using JavaScript. CSS Grid and Flexbox were used primarily for the layout. I was given mockup images for the mobile, tablet, and desktop views, along with a link to charts.js. There was a study guide but it was very problematic and sparse. There was outdated information and it was more a headache to use than a help, so I ditched it and learned what I needed to know on my own. This was the largest project to date and I felt going into it that it would be a great test to see just how much knowledge I had learned up to that point. Previous projects had bits and pieces provided but this one was to be done from scratch. I was excited to get into it and learn some new techniques.
The main learning curve with this project was learning how to implement the charts. I used the information from charts.js to build each section step-by-step. Each section had its own set of new problems that I was able to solve.
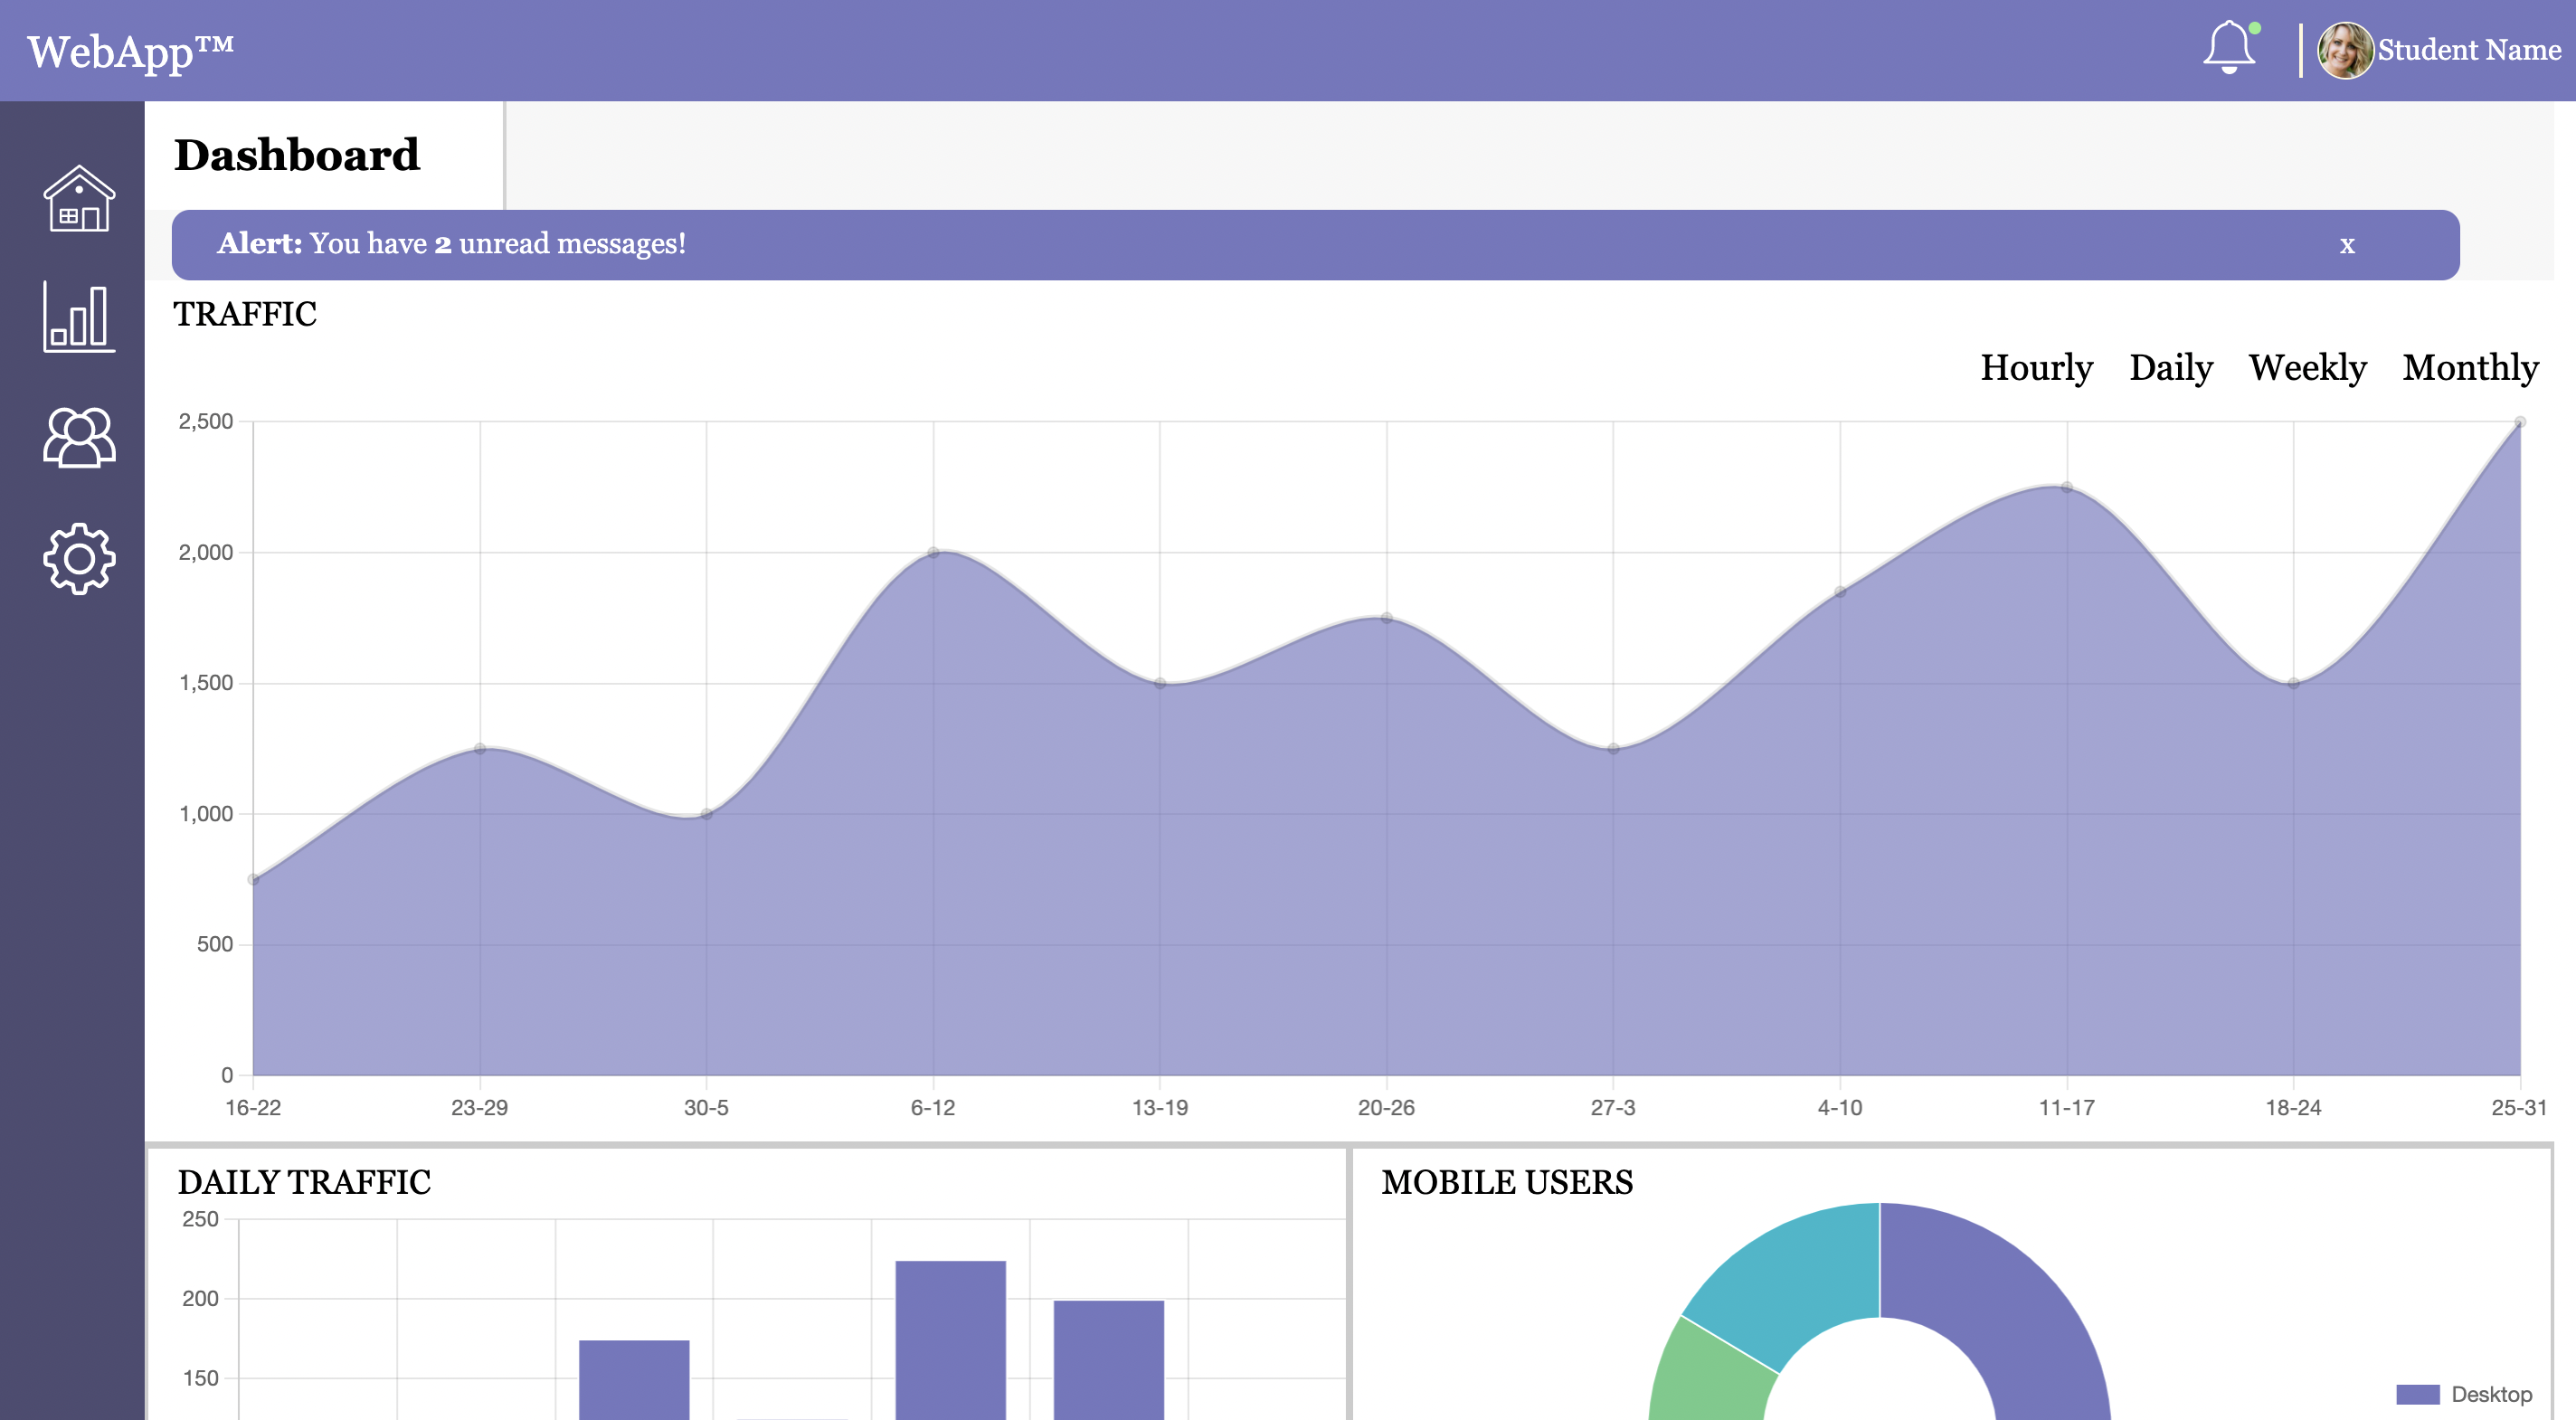
The alert banner was where I found my first problem. This was from some misinformation from the study guide. I corrected the issue and informed my fellow Treehouse students and instructor. This was about when I decided to stop using the study guide and challenge myself to just build it myself. The problem was simple - pressing the "X" to close the alert banner did not close it at all. The solution was to reference a different variable and set its display to "none".
In the top right corner, next to the user, is a notification bell. When there are notifications a green dot appears on the bell. After you click the bell and see a drop down menu of notifications, the green dot disappears. For this, I needed to learn how to make drop down menus in JavaScript. I did some reading and stumbled upon a YouTube Video that really helped. When I come across something that is new or not working the way I expect, the first thing I do is look it up. Spending 15 minutes researching has saved me a lot of time because I am not being frustrated going in circles and wondering why it isn't working. This way I get my answer quickly and can test and check. I usually look at least 3-5 resources/examples to understand the concept of the code and then I give it a try for what I am trying to create.
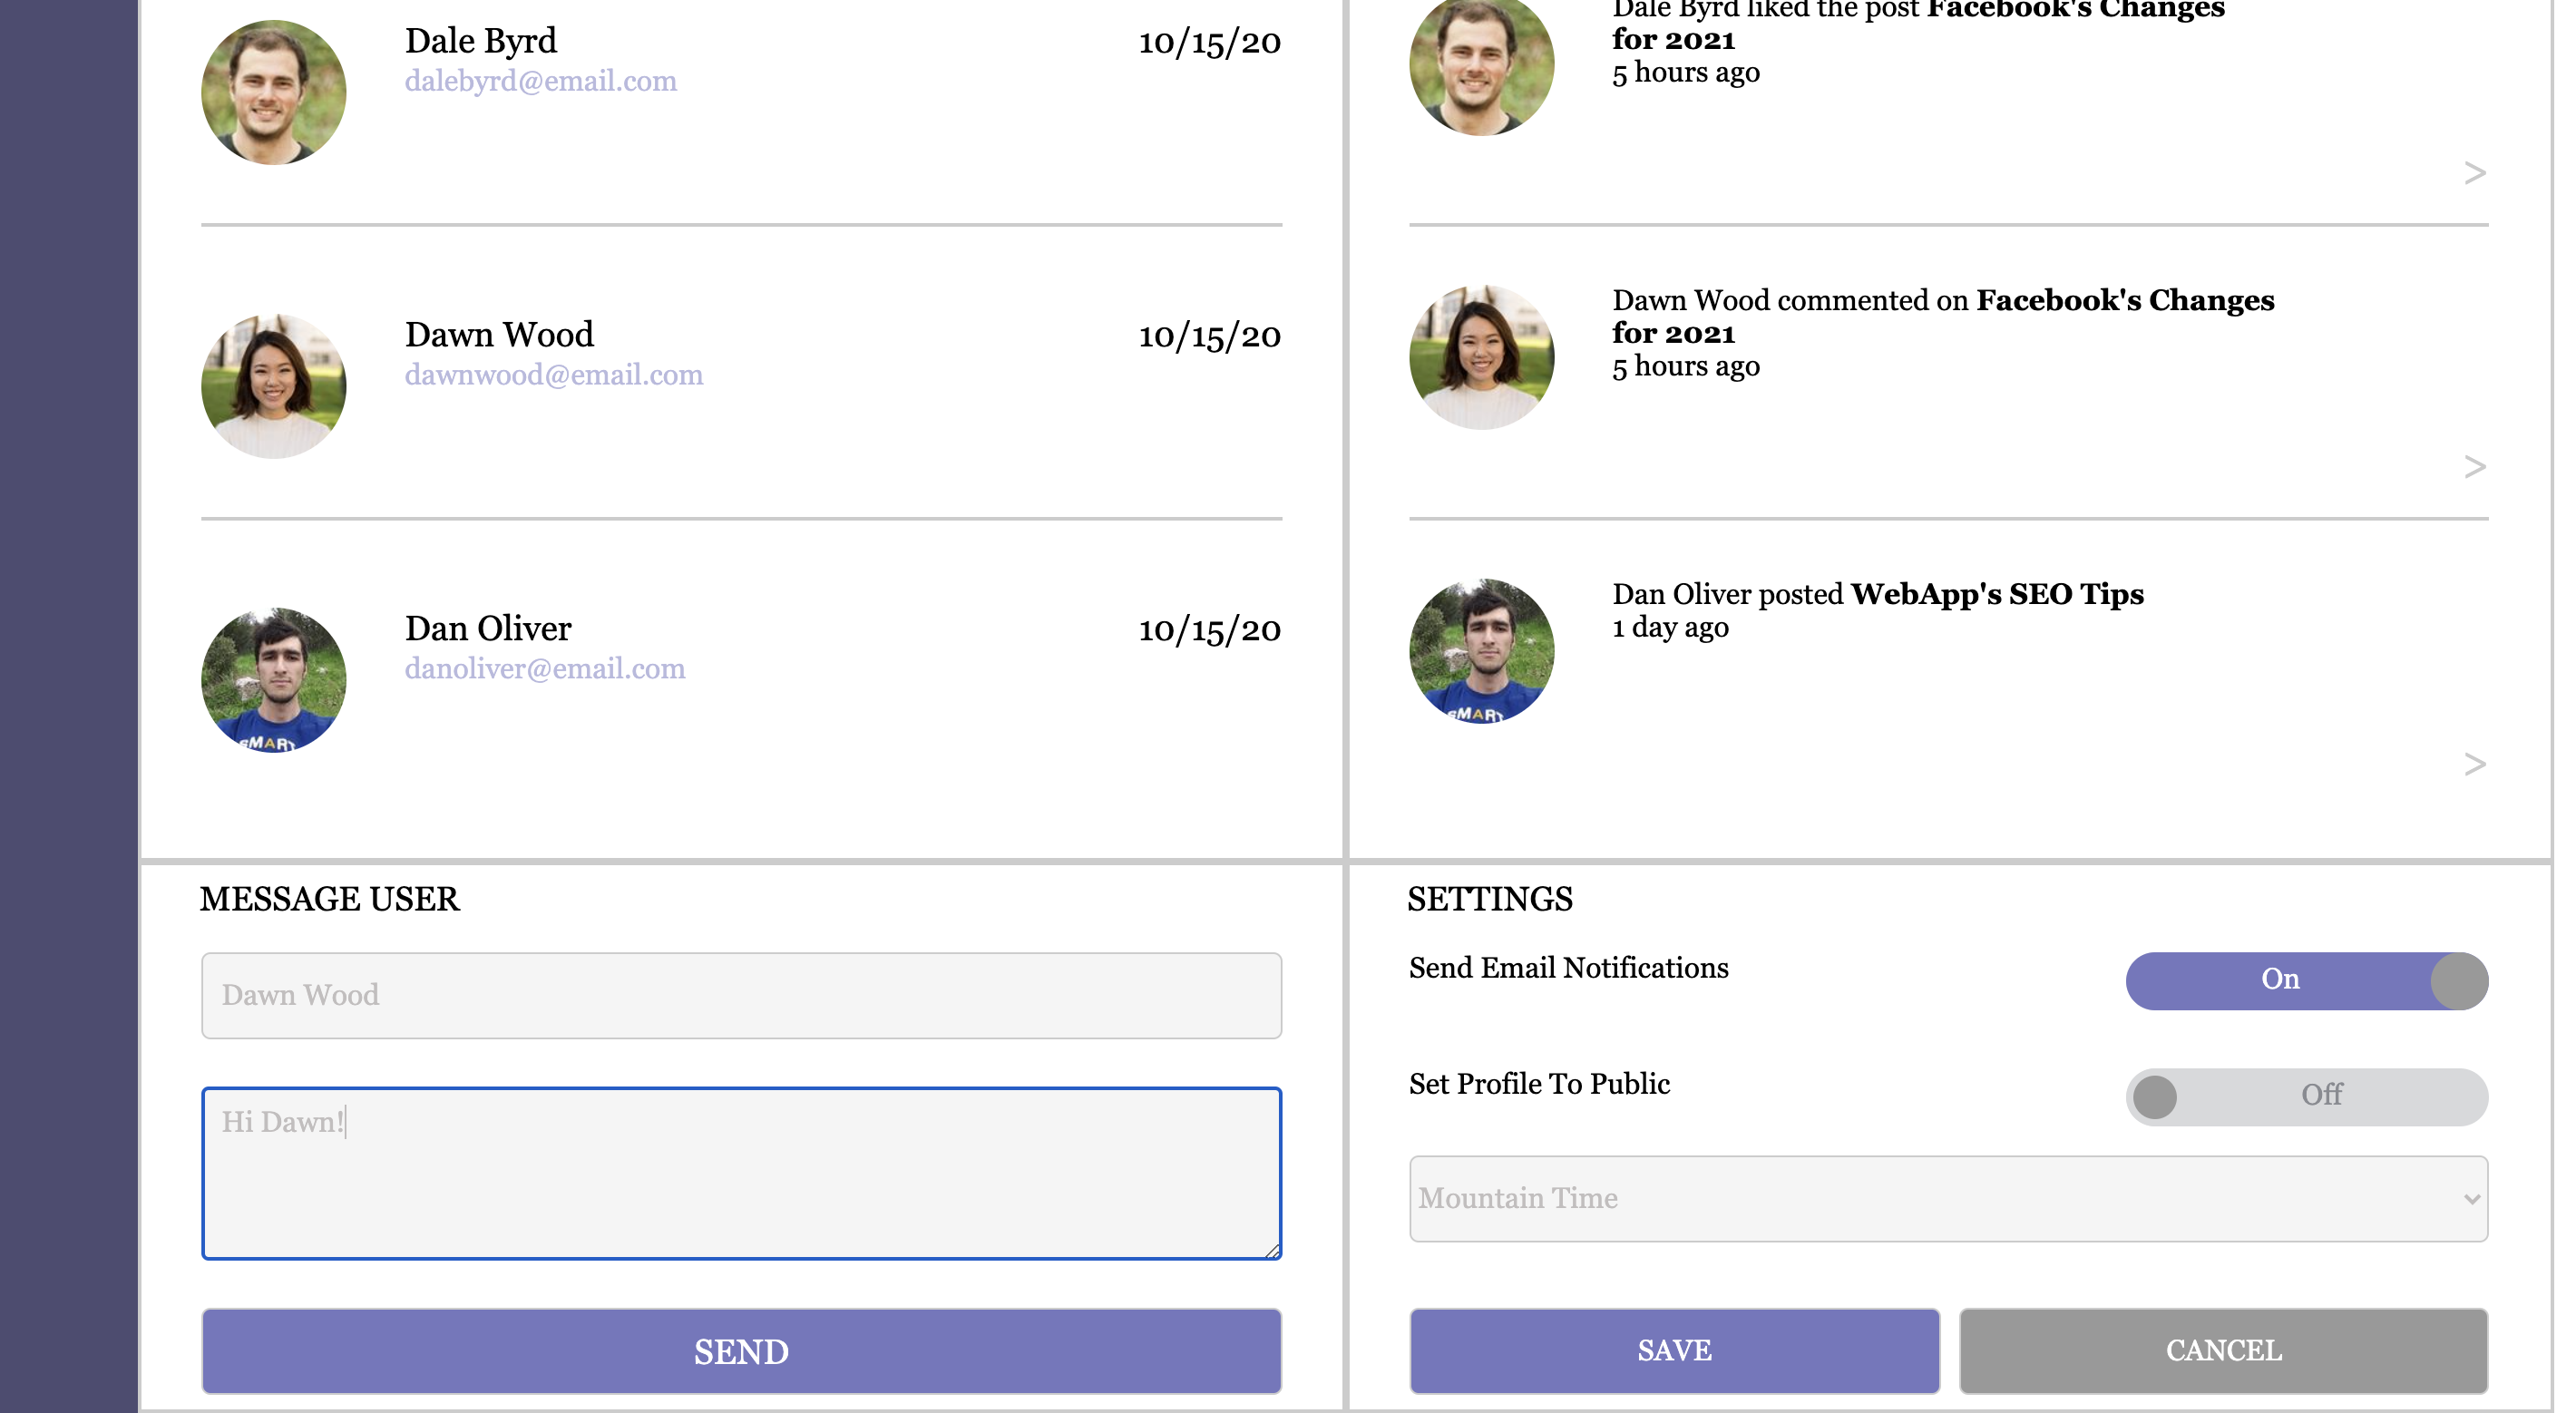
Toggle switches were another new feature I learned while doing this project. I needed two toggle switches (email, profile) and a drop down menu for timezones. The tricky part about this was to use local storage to save the selections. The problem is that I hadn't done this before, so I started by making a list of things I thought I needed to know in order to make progress. My list involved,
The next step was to learn how to make local storage work. I read a few things and came across this stackoverflow link and this blog post. I put in some unique IDs and tried to create the save function. After awhile of it not working despite looking things up, I emailed my instructor for help. Thankfully, he found a mistake where I included a JSON.parse() that was unnecessary. I had thought it was necessary because I was using it for the other get requests and those worked just fine. So it was ok to use for toggle switches but not saving a drop down menu item (timezone).
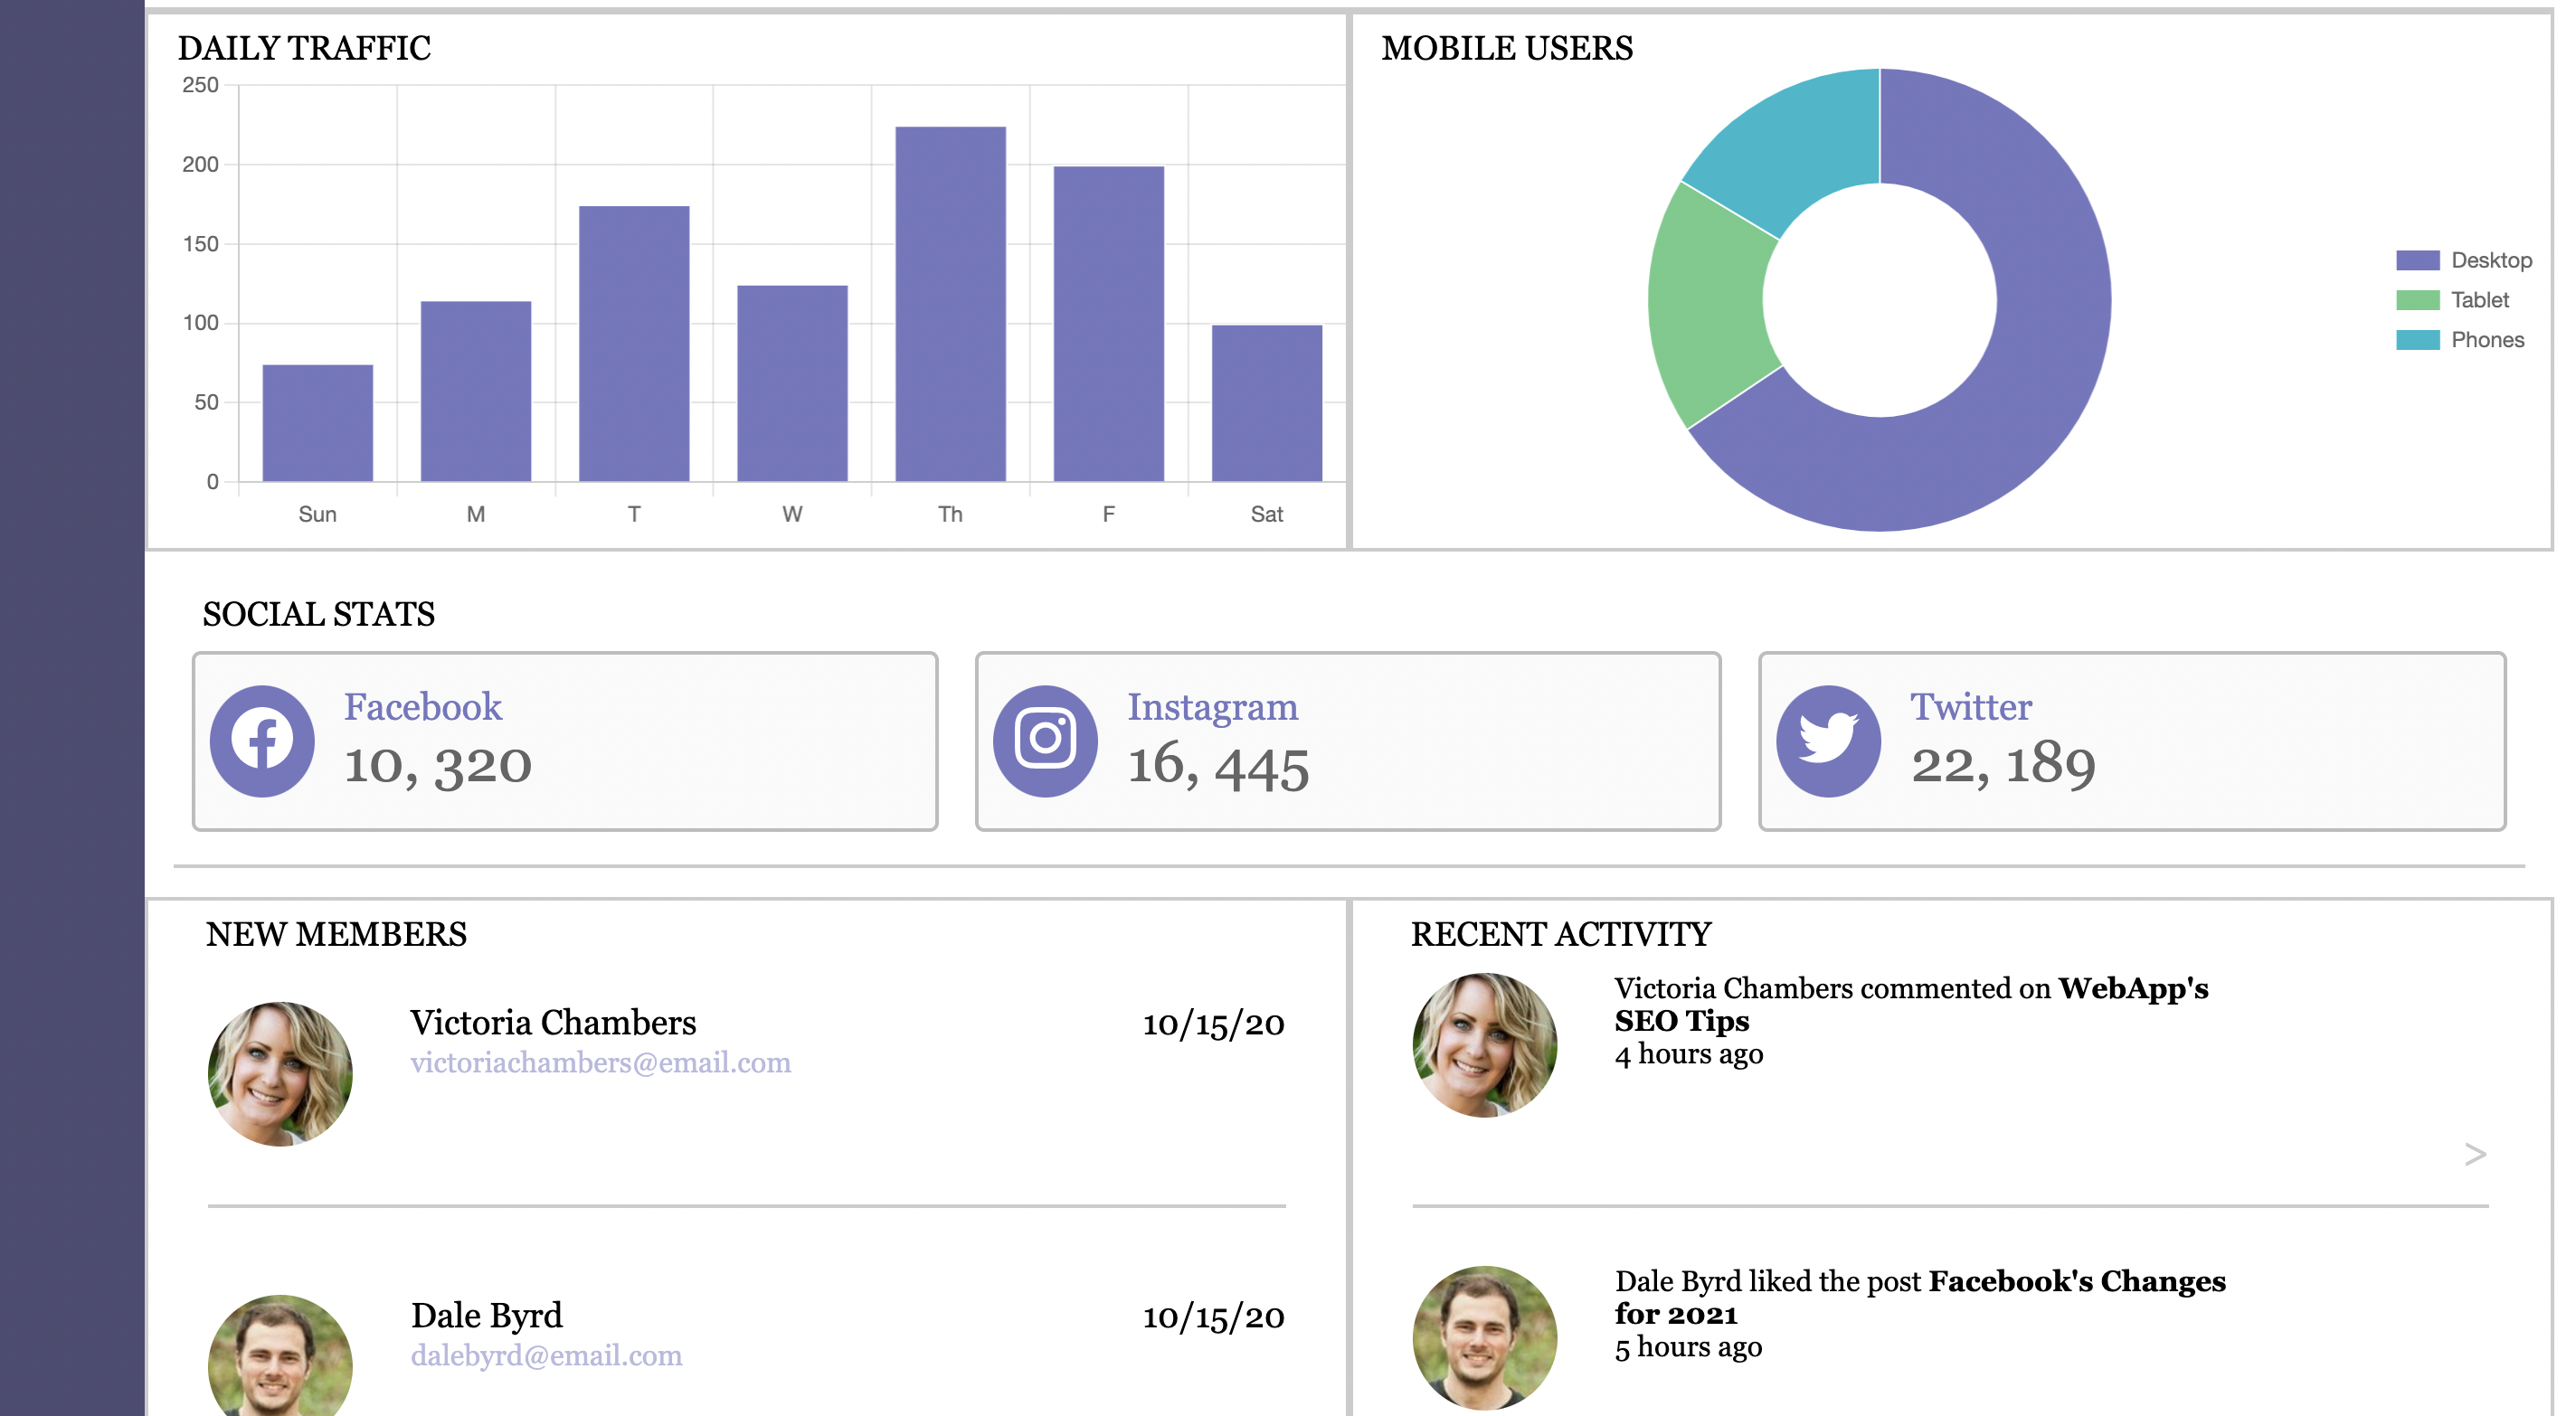
This project was the largest one to date and I was able to learn quite a few new things. I was able to use CSS Grid and Flexbox in more depth for the layout, and as a result was able to really appreciate how powerful these tools are for a layout with subsections, or widgets. I also learned how to utilize the JavaScript chart.js resource, local storage, and improved my skills with JavaScript functions via the message sent confirmation, alert banner, toggle switches, timezone menu, and notification bell. SVG images were another new feature that I found I quite liked using due to how easy it is to adapt their size, shape, and color without losing image quality.
Overall, this project demonstrates a modular approach of having multiple sections come together in a coherent design. JavaScript plugins keep the chart information up to date without having to manually update the webpage itself.